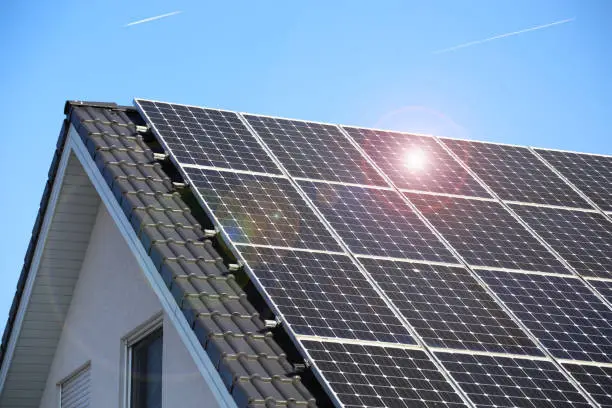
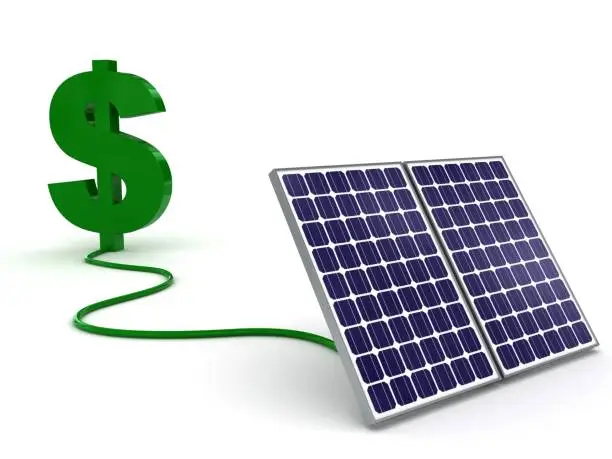
⚡ Semi-Transparent Solar Windows & Smart Homes: Future of Zero-Energy Apartments
• Smart Window Design Algorithms
Semi-transparent solar windows combine organic photovoltaics (OPVs) or perovskite coatings with transparent conductive layers. Algorithms in material science optimize deposition thickness and cell patterning so that enough visible light passes through while invisible infrared is harvested for electricity. These design algorithms use multi-objective optimization: maximize electricity output while keeping transparency above human comfort thresholds.
• Balancing Light and Power Output
The key trade-off is between room brightness and energy yield. A window with 60% transparency may generate 40% less electricity compared to a 30% transparency design, but the brighter room reduces reliance on artificial lighting. Engineers often create hybrid zones—upper panes optimized for energy, lower panes optimized for visibility.
• Mathematics of Transparency Efficiency
The energy efficiency (η) of semi-transparent modules can be expressed as:
General formula:
η = Pout / (A × G) × 100%- η (Efficiency): How good the solar panel is at turning sunlight into electricity.
- Pout: The actual electricity the panel gives you (like the output in watts).
- A × G: How much sunlight is falling on the panel (sunlight power per square meter × panel size).
- \(P_{out}\) = Power output (watts)
- \(A\) = Surface area \((m^2)\)
- \(G\) = Solar irradiance \((W/m^2)\)
Example Calculation:
For a 1 m² solar panel generating 90 W under 1000 W/m² sunlight:
η = 90 / (1000 × 1) × 100% = 9%This calculation shows why current prototypes average between 8–12% efficiency.
• Integrating Windows into Grid Models
When hundreds of apartments are equipped with solar windows, the output is highly variable due to shading, orientation, and weather. Smart inverters with multi-MPPT tracking can stabilize this by dynamically adjusting to each façade panel. In effect, each window becomes a mini power plant feeding into the building’s microgrid.

• Thermal Comfort vs Energy Yield
Unlike traditional windows, solar glass filters infrared radiation, reducing interior heat load. This cuts air-conditioning demand by 10–15%, effectively saving more energy than the direct electricity contribution in hot climates. A real-life dual benefit emerges: cooler apartments and lower energy bills.
• AI Control Systems for Smart Apartments
Smart home controllers powered by AI optimize how solar windows interact with other appliances. For instance, windows can auto-dim during peak sun to prevent glare, while redirecting energy into battery storage. Predictive algorithms use weather forecasts to plan whether to store energy, supply to the grid, or operate appliances like HVAC systems.
• Cost Comparison: Glass vs Solar Windows
- Double-glazed glass: $60/m²
- Current solar glass prototypes: $250–300/m²
- Projected mass-production cost (2030): ~$120/m²
Though currently expensive, economies of scale and technological maturity will shrink this gap. Over a 20-year lifecycle, savings in energy bills can offset the higher upfront cost.
• Case Study: Prototype Apartment Trials
In South Korea, a pilot apartment block integrated perovskite windows. Tenants reported:
- 20–25% reduction in grid electricity consumption
- Noticeable decrease in indoor heat during summer
- Increased willingness to pay for solar-integrated homes
• Urban Planning with Solar Windows
Urban planners view transparent solar façades as the solution to rooftop space limitations. High-rise buildings can turn their vertical surfaces into solar farms, producing up to 50–70% of a building’s energy demand without altering skyline aesthetics.
• Graphical Analysis of Transparency vs Power
The trade-off between visibility and generation can be illustrated:
- 20% transparency → 100% relative power output
- 40% transparency → 80% relative power output
- 60% transparency → 60% relative power output
- 80% transparency → 30% relative power output
- 100% transparency → 0% relative power output
This nonlinear curve shows diminishing returns: above 70% transparency, power drops sharply.
• Real-Life Example: Singapore Smart Flats
Singapore tested semi-transparent solar windows in government-built housing. Results:
- 12% lower household energy bills
- Improved indoor comfort
- Positive feedback from residents on aesthetics and performance
• Policy Push for Energy-Active Facades
Governments may push for “energy-active building codes” where new urban construction requires solar façades. Incentives such as subsidies, tax rebates, or green certification credits can accelerate market adoption.
• Durability and Long-Term Testing
The early weakness of perovskite solar windows was UV degradation. Recent encapsulation methods now extend expected lifespans to 15+ years, making them comparable to traditional glass windows in durability.
• 2030 Roadmap for Smart Homes
By 2030, projections suggest:
- 15% module efficiency
- Cost parity with premium glass
- Integration with smart-grid-ready appliances
This creates realistic pathways for net-zero apartments in urban centers.
• Final Thoughts: Transparent Energy Future
Semi-transparent solar windows embody the convergence of architecture, energy, and AI. They allow homes to generate energy without sacrificing comfort or beauty. By 2030, they could transform millions of apartments into mini power stations, pushing cities closer to self-sufficiency.
⚡ 2025 Race for N-Type Cells: Who Will Dominate After PERC’s Decline?
• Evolution from PERC to N-Type
PERC cells dominated the previous decade, but physical constraints cap their efficiency for mass production at about 23%. The time has arrived for N-type technologies—TOPCon, HJT, and IBC—to take center stage as the natural heirs.
• Market Shift Algorithms
Market adoption can be modeled with a logistic growth algorithm:
Where:
- M(t): The market share or value at a specific time t.
- Mmax: The highest point the market or growth can reach (the limit).
- k: The speed of growth — how fast the value increases.
- t0: The midpoint or turning point where growth starts to slow down.
Assuming that N-type is likely to have 60% market share in year 2030, the estimates have shown that its adoption curve is going to shoot upwards steeply after year 2025 when PERC capacity is being phased out.
Efficiency Race Breakdown
- PERC: 21–23%
- TOPCon: 23–25%
- HJT: 23–26%
- IBC: 24–27%
This tiny 2–3% efficiency improvement might seem insignificant but translates to monstrous land and cost savings in volume.
• Cost Competitiveness Curve
2023 N-type cells are 10–15% higher priced per watt compared to PERC. Automation and 2025 increases in wafer size will cut this premium to 3–5%. Graphically, this cost curve is of decreasing exponential slope and reaches PERC parity in 2026–27
• Thermal Stability Advantage
Relative to PERC, N-type cells have reduced light-induced degradation (LID) and better thermal stability. In CCI of India's or the Middle East's hot climates, this is equivalent to 3–5% more long-term yield, an important advantage for utility-scale solar farms.
• Case Study: Utility Plant in Desert Climate
A Saudi Arabian utility-scale site compared comparable arrays: a PERC array and a TOPCon array. After 18 months, the TOPCon field generated 4.2% more power, validating real-world performance projections.
• Manufacturing Bottlenecks
The bottlenecks are:
• Additional capex for new deposition machines
• Utilization of silver paste in HJT (added raw material expense)
• Lower throughput due to complex layer stacks
They will determine which technology will ramp up the fastest.
Technology Variants Comparison
• TOPCon: Less roller coaster adjustment from current PERC lines → Chinese giants' favorite.
• HJT: More efficient but lower capacity → high-end market promise.
• IBC: Fragile design but highest theoretical efficiency → high-end rooftop or space niche.
Graph: Efficiency vs Cost
Following the viewing of the trade-off
- PERC: Low price, low efficiency
- TOPCon: High price, moderate to high efficiency
- HJT/IBC: Highest price, highest efficiency
Policy Impact on N-Type Adoption
Governments offering feed-in tariffs on module efficiency can accelerate the transition. For example, an additional $0.01/kWh incentive on >24% efficient modules will make the market switch to N-type very rapidly.
End-User Economics
In the home market, the incremental initial cost of N-type panels can be recouped with levelized cost of electricity (LCOE):
LCOE = Total Lifetime Cost ÷ Total Lifetime Electricity Produced
Let a PERC system produce 120,000 kWh and N-type 126,000 kWh over its life, at a pathetic 5% premium. The LCOE is less for the N-type, so that's the better one.
• Global Race: Who's Ahead?
China
- Large-scale TOPCon upgrades
- Key players: Jinko, LONGi, JA Solar
Japan & Korea
- High-end HJT
- Key players: Panasonic, Sharp
Europe & US
- IBC for rooftop & specialty markets
📈 2030 Market Share Predictions
- TOPCon: 50%
- HJT: 25%
- IBC: 10%
- Legacy PERC: <10%
- Others: 5%
This division reflects the fact that while all N-type alternatives will grow, TOPCon's versatility within mature lines ensures dominance in the near term.
Last Thoughts: Beyond N-Type
N-type rivalry is not the final—tandem cells and perovskite-silicon hybrids are on the horizon. Nevertheless, between today and 2030, N-type technologies will be the norm in the industry, transforming efficiency economics as well as supply chain planning.
⚡ Ground Screw Foundations vs Driven Piles: Which Works Best for Sandy Soil?
Foundation Basics in Solar Farms
Solid foundations support ground-mount PV systems to withstand bearing loads, soil wash-away, and wind. Two conventional methods are:
- Ground screws: Helical screws screwed into the ground.
- Driven piles: Hammered steel beams into the ground.
Sandy soil poses unique challenges due to low cohesion.
Load-Bearing Mathematics
Foundational strength is approximated using bearing capacity equations. In sandy soils:
Qult = σ′ × Nq × A
- Qult: Maximum load capacity
- σ′: Effective soil vertical stress
- Nq: Bearing capacity factor (depends on soil friction angle)
- A: Foundation area
This means foundation stability depends on soil density and contact area.
Ground Screw Advantages
- Simple to install in loose sandy ground without pre-drilling.
- Lateral stability provided by helical threads.
- Removable, reusable, and eco-friendly.
- Portable for sloping or mixed soils.
Driven Pile Advantages
- Smaller unit cost in mass installations.
- Preferred in large-scale utility projects.
- High vertical load capacity in dense sand soils.
Case Study: Coastal Solar Farm
A 10 MW Spanish coastal installation compared both methods:
- Driven Piles: Pre-compaction needed to avoid tilting.
- Ground Screws: 25% lower labor time, faster install, fewer refusals.
For sandy soil with groundwater risk, ground screws performed better due to lower settlement risk.
Cost Curve Analysis
Estimated cost per unit foundation:
- Driven piles: $80–100
- Ground screws: $110–130
But with compaction costs included, ground screws may be more economical.
Graphical Comparison: Cost vs Stability
- Piles driven: Stable in prepared sand, but costly.
- Ground screws: Slightly costlier per unit, but lower prep cost.
Outcome: Ground screws are more reliable in sandy soil.
Longevity in Sandy Soils
Sandy soils settle quickly, reducing corrosion hazard compared to clay. Ground screws last 25–30 years with hot-dip galvanization, similar to piles.
Speed of Installation & Labor
- Ground screws: Small rigs, 2-man crews, up to 50 units/day.
- Piles: Require heavy hydraulic breakers, slower installation.
Environmental Considerations
- Ground screws: Minimal ground displacement, reusable, circular economy friendly.
- Driven piles: Harder to remove, often left as rubble.
Mathematical Comparison: Tilt Risk
Rtilt = Mwind ÷ (Qult × L)
- Mwind: Overturning moment from wind
- L: Embedment depth
Deeper embedment (e.g., screws) minimizes tilt risk in loose soils.
Policy & Standards
In Australia, reusable foundations (ground screws) are promoted for sustainability. Some tenders award extra points for screw-based systems.
Examples of Global Adoption
- Australia: Prefers ground screws for sandy off-site builds.
- Middle East: Piles dominate large farms, but screws gain traction for mid-scale farms.
Future Outlook
As desert and coastal solar projects grow, sandy soil challenges will increase. Ground screws will dominate small-to-medium projects due to adaptability, while piles remain viable for mega-scale farms with compaction.
Final Verdict: Which Wins?
Ground screws: Versatile, faster, recyclable, and ideal for sandy soils. Driven piles: Best for very large projects with economies of scale.
⚡ Drone-Assisted Installation: First Pilot Projects and Safety Challenges
One of the smartest way to inspect land or area before panel installation. Solar installations are growing larger and more complex. Manual installations are fatigue-heavy, risky, and time-consuming. Drones are forward-thinking: they can carry, deploy, and assist with module installation — reducing human exposure and enabling quicker deployment.
The 2025 Pilot Projects
Germany
- 5 MW farm
- Drones used to offload light modules onto mounting structures
Japan
- Rooftop test in dense urban sites
- Drones enabled installation where cranes were impracticable
India
- Utility-scale farm
- Drones moved tools and small equipment within the site
- 15–20% time saved
- Workers’ exposure to heat and heights minimized
Mathematical Time Efficiency Model
Tdrone = α·Ttransport + β·Tplacement
- α, β < 1 → efficiency multipliers of drones
If drones save 40% in transport (α = 0.6) and 30% in placement (β = 0.7):
Tdrone = 0.6(100) + 0.7(80) = 116 hours
Versus manual: Tmanual = 180 hoursResult: 36% time saving.
Drone Payload Constraints
- Payload range: 5–20 kg
- Solar panels: 18–25 kg → near maximum capacity
- Heavy-payload drones (>40 kg) under development but not yet feasible
Cost Comparison
- Traditional crane hire: $1,000–2,000/day
- Industrial drones: $600–900/day
- Small drones: $200–300/day
Conclusion: Drones already replace cranes in medium-scale projects.
Safety Benefits
- Reduced worker exposure to falls
- Less human-heavy lifting → fewer injuries
- Drones can move life-saving equipment in emergencies
Safety Concerns
- Crash impact risk: 2–3% per 100 flights
- Strong winds decrease stability
- Limited battery: 20–30 minutes per cycle
Japan Rooftop Case Study
- 6 kW rooftop installation with drones
- Only clamp bolt tightening done manually
- 25% installation time reduction
- Limitation: strong gusts over high-rise areas
Mathematical Safety Risk Model
- Pfailure = drone failure rate (e.g., 0.02)
- Cimpact = cost of damage (e.g., $300 per module)
R = 0.02 × 300 = $6 per flight
Note: Insurance is required to cover drone-related risks.
Environmental Footprint
- Drones are more carbon-efficient than cranes
- Rechargeable batteries allow clean operation with solar microgrids
- Battery lifetime (~500 cycles) adds recycling complexity
Policy and Regulation
- Drones banned in many populated areas
- Pilot certification is becoming mandatory
- Aviation laws complicate large-scale drone deployment
Future Directions
- AI computer vision for autonomous stabilization
- Swarms of drones for large-scale synchronized deployment
- Hybrid crane-drone systems for heavy + precision work
⚡Cyclone-Proof PV: Designing Wind-Resistant Structures for Coastal Regions
Solar farms are expanding into the tropics and coastal regions, where cyclones and hurricanes pose major threats. Flooding, windstorms, and flying debris can destroy poorly designed PV systems and cost millions. That’s why cyclone-proof structural designs are no longer optional—they are essential.
Wind Load Calculations
Wind pressure on panels can be estimated using:
Wind Pressure = 0.613 × (Wind Speed)² × Drag Factor
- Wind Pressure: Force per square meter of panel (N/m²)
- Wind Speed: in meters per second (m/s)
- Drag Factor: ~1.2 for flat panels
Example: For a 60 m/s cyclone (~216 km/h), wind pressure ≈ 2,650 N/m². That’s about the weight of a small car pressing on each square meter of panel. For a 2 m² panel, total force = 5.2 kN.
Structural Design Strategies
- Low Tilt Angles (≤10°) to reduce uplift forces.
- Aerodynamic Mounting with curved or deflector frames.
- Deeper Anchors using piles or ground screws.
- Reduced Row Gaps to prevent wind tunnels.
- Double-Bolt Clamps or hurricane-rated fasteners.
Case Study: Philippines Solar Farm
- System size: 50 MW coastal project
- Used low-tilt aerodynamic frames
- Survived Typhoon Mangkhut (200 km/h winds, 2018) with less than 1% module loss
- Nearby farm with standard mounts lost ~30% modules
Cost Implications
- Standard Mounting: $0.12/W
- Cyclone-Proof Mounting: $0.18–0.22/W
A 10 MW plant would cost an additional $600,000–$1,000,000. But potential damage avoided per cyclone event is $2–3M.
Return on Investment (ROI)
ROI = Damage Avoided ÷ Extra Cost
Example: $2M avoided damage ÷ $0.8M cost = 2.5 → Every $1 invested saves $2.5 in future cyclone damage.
Rooftop Solar in Cyclone Locations
- Flat-mounted panels are safer than rack-mounted ones.
- Ballasted systems are risky—high winds can push them aside.
- Roof-integrated PV tiles are more durable (but cost more upfront).
Wind Resistance Materials
- Aluminum alloys with steel reinforcement → light but strong.
- Tempered glass → resistant to debris impact.
- Anti-corrosion coatings → resist saltwater damage.

Cyclone Safety
- Automatic storm shutdown systems.
- Cyclone mooring systems required in high-risk zones.
- Insurers now demand cyclone-certified designs.
Policy and Standards
- Australian AS/NZS 1170.2 and IEC 62817 set global standards.
- Coastal tenders require panels tested for >200 km/h winds.
- Countries like India, Philippines, and Florida increasingly demand stronger mounts.
Wind Speed vs Failure Rate
- <150 km/h: Normal design is safe.
- 150–200 km/h: 20–40% loss (normal) vs <5% loss (cyclone-proof).
- 200 km/h: Normal = total failure, Cyclone-proof = only partial damage.
Future Developments
- Self-leveling tilt systems that adjust automatically.
- Composite materials: lighter but still strong.
- AI-based wind forecasting for proactive panel positioning.
⚡ Agrivoltaic Farms: Should Governments Give Direct Incentives in 2025?
Agrivoltaics combines agriculture and solar power by allowing crops to grow under or between solar panels. This dual-use system helps maximize land efficiency by producing both food and clean energy at the same time.
Why Incentives Matter
Farmers are unlikely to adopt agrivoltaics unless supported with subsidies because:
- It requires higher upfront investment (special mounting, irrigation systems).
- There’s uncertainty about crop yield under solar panels.
- The payback period is longer compared to traditional farming.
Government rebates and incentives reduce risk and encourage adoption.
Yield Sharing Math
Total Yield = Crop Yield + Energy Yield
- Crop Yield: Harvest from farming under the panels
- Energy Yield: Electricity from the solar panels
Example:
- Normal farm: 100% crop yield
- Agrivoltaic farm: 85% crop yield + 40% energy yield = 125% total yield
👉 That’s 25% more productivity per hectare compared to traditional farming.
Real-Life Example: Japan
- 2019 pilot project using rice paddies with solar panels.
- Crop yield: 80–90% of normal output.
- Solar yield: 30–35% added income.
- Farmers earned an extra $4,000 per hectare per year.
Cost and Incentive Dynamics
- Standard PV: $0.90–1.00 per watt
- Agrivoltaic PV: $1.10–1.30 per watt (20–30% more expensive)
A $0.20/W government subsidy can bridge the cost gap and make agrivoltaics competitive.
Profitability with Incentives
- Without incentives: 10–12 years payback
- With incentives: 6–8 years payback
Incentives shorten the payback time and make agrivoltaics more attractive to farmers.
Environmental Benefits
- Reduces water evaporation by 20–30%.
- Creates microclimates that protect crops from heat and storms.
- Makes land use 40–60% more efficient.
Policy Examples
- France: Feed-in tariffs for agrivoltaics.
- India: Subsidies for small farmers with solar pumps + crop shading.
- USA: 2023 Inflation Reduction Act provides tax credits for dual-use agrivoltaics.
Mathematical ROI for Farmers
Case Study: 100 kW System (Cost: $200,000)
- Annual solar revenue = $15,000
- Crop revenue (15% lower) = $8,500
- Total = $23,500 per year
Payback without incentives: $200,000 ÷ $23,500 ≈ 8.5 years
Payback with $40,000 grant: $160,000 ÷ $23,500 ≈ 6.8 years
👉 Incentives save nearly 2 years of payback time.
Social Impact
- Farmers can earn more without abandoning agriculture.
- Generates rural jobs for installation and maintenance.
- Provides food and energy security in climate-exposed areas.
Challenges
- Panels must be high enough to allow proper sunlight for crops.
- Irrigation systems need redesign to fit panel layouts.
- Shade-tolerant crops (like wheat) perform better than corn under panels.
Future Developments
- Adjustable-tilt solar panels that optimize sunlight for crops.
- Transparent or semi-transparent PV modules to let more light through.
- AI-powered sensors to monitor shading and crop growth for maximum efficiency.
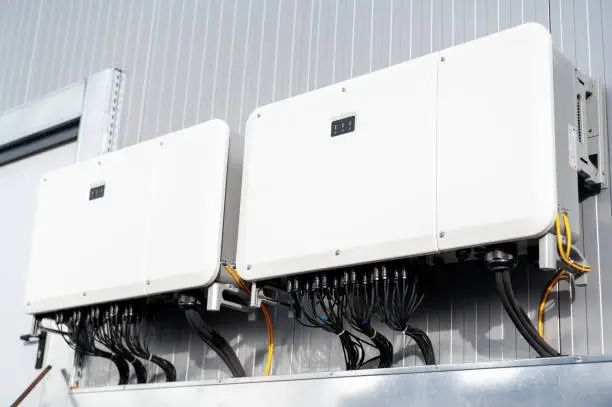
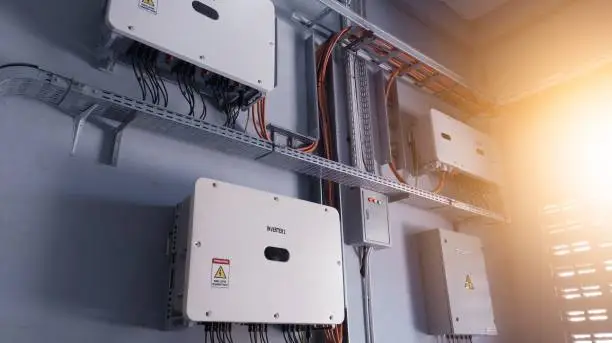
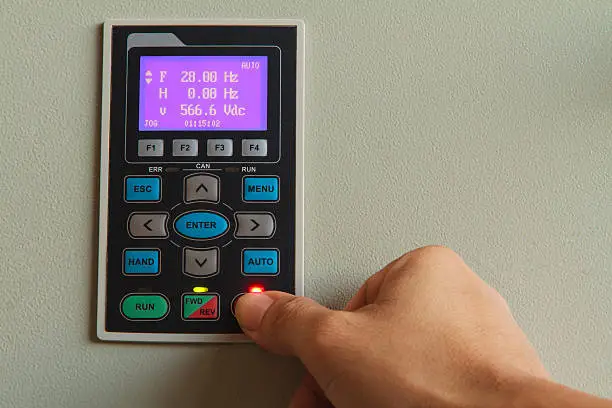
⚡ Microinverters vs String Inverters: Which Survives in Harsh Climate Testing?
Why the Inverter War Matters
Solar panels generate DC power, but inverters are needed to convert it into AC power that homes and businesses can actually use. From blistering deserts to freezing winters and humid coasts, inverters are often the weakest link in solar systems. The ongoing battle: Microinverters vs. String Inverters.
Simple Definitions
- String Inverter: One central inverter connects multiple panels in a series.
- Microinverter: A small inverter is installed on the back of each panel.
Reliability Math Model (Made Simple)
System Reliability = 1 − (chance of one failing × number of units)
- String inverter system: 1 inverter with 5% failure chance → ~5% failure risk.
- Microinverter system: 20 small inverters, each with 0.5% failure chance → ~9.5% combined risk.
👉 While microinverters are more reliable individually, having more components increases system-wide failure probability.
Severe Climate Stress Factors
- Heat (Deserts): Microinverters get hot (mounted behind panels, often >60°C). String inverters, mounted in shaded areas, last longer.
- Cold Weather: Central inverters suffer from thermal stress, while microinverters spread the risk.
- Humidity & Salt: Microinverters with IP67 protection resist salty coastal air better than indoor string inverters with cable vulnerabilities.
Case Study: Dubai Rooftop Solar
- String inverters: 2× more summer failures at 45–50°C ambient temperature.
- Microinverters: 98% uptime, but some units failed early due to electronics stress.
Effect on Performance
- String inverters: If one panel is shaded, it reduces the whole string’s output.
- Microinverters: Each panel works independently → 5–15% higher yield on complex rooftops.
Cost Comparison
- String inverter: $0.10–0.15 per watt → ~$1,200 for a 10 kW system
- Microinverter: $0.25–0.35 per watt → ~$3,000 for a 10 kW system
👉 Microinverters are ~2.5× more expensive than string inverters.
Cost vs Performance Tradeoff
- String inverters: Low upfront cost, but risk of total system shutdown if the inverter fails.
- Microinverters: High upfront cost, but better shade tolerance and more stable output.
Safety Issues
- Microinverters: Operate at low-voltage AC per panel → reduced fire risk.
- String inverters: High DC voltage (600–1000V) → higher risk of dangerous arc faults.
ROI in Hostile Environments
Example: A 10 kW rooftop near the coast
- String inverter: ROI ≈ 12 years (replacement needed every 6–7 years).
- Microinverter: ROI ≈ 9 years (25-year warranty, extra yield).
ROI Formula (Layman Format)
Extra ROI (%) = (Extra Energy Earned − Extra Cost) ÷ System Cost
Example: Extra energy = $4,000, Extra cost = $1,800, System cost = $15,000
ROI Gain = (4000 − 1800) ÷ 15000 ≈ 14.7%
👉 Microinverters pay back faster in cloudy, coastal, or shaded conditions.
Global Adoption Trends
- US: Microinverters growing rapidly in residential markets.
- India & Africa: String inverters dominate due to lower costs.
- Europe: Hybrid trend—string inverters for large solar farms, microinverters for rooftops.
Future Outlook
- Smarter string inverters with multiple MPPT inputs and cooling systems.
- Mass adoption of microinverters with built-in battery integration.
- AI-powered predictive monitoring for early failure detection.
⚡ Fast Frequency Response with Solar Inverters: Role in Preventing Blackouts
Electricity grids run at a constant speed (frequency):
- 50 Hz in most of the world
- 60 Hz in the US
- Too much demand → frequency drops → blackout risk
- Too much supply → frequency rises → unstable grid
🚀 What is Fast Frequency Response (FFR)?
FFR is like a “reflex” of solar inverters. They react within 100–250 milliseconds after a disturbance, injecting or absorbing power to keep the grid stable. It works like synthetic inertia.
📊 Formula in Simple Words
The grid’s frequency wobble depends on:
- How big the power imbalance is (ΔP)
- How much “momentum” the grid has (H)
- The normal operating frequency (f₀)
Formula:
Δf = ΔP / (2 × H × f₀)
- Δf = frequency deviation
- ΔP = power imbalance
- H = system inertia (like momentum)
- f₀ = normal grid frequency (50 or 60 Hz)
👉 Small inertia (H) in solar systems = small imbalance creates big instability.
🔧 How Inverters Provide FFR
- Droop Control: inverter reduces or increases output in proportion to frequency change.
Formula: ΔP = -K × Δf - Battery Support: stores spare solar power, instantly injects when frequency falls.
- Reserve Headroom: keep 5–10% solar unused so it’s ready to stabilize the grid.
🌍 Real Example – South Australia
- Coal plants closed → blackouts
- Tesla Hornsdale battery + solar farm reacted in 140 ms
- Saved 90% of blackout costs
💰 Cost vs Benefit
- Conventional frequency reserves: $10–20 per MWh
- Solar + inverter FFR: $3–7 per MWh
Example:
100 MW solar farm
10% reserve = 10 MW
Revenue at $7/MWh ≈ $600,000 per year
⚠️ Challenges
- Lost Solar Sales: holding 5–10% in reserve feels like wasted sunshine
- Inverter Stress: frequent switching wears out electronics
- Policy Gaps: many countries don’t yet reward FFR

🔮 Future Outlook
- Australia, UK, US already testing FFR markets
- AI inverters will predict problems before they happen
- Solar + storage hybrids will be 2030’s stable grid backbone
✨ Final Word
Solar inverters are no longer just “DC-to-AC boxes.” They are becoming digital guardians of the grid:
- Stop frequency dips in milliseconds
- Prevent blackouts
- Create new revenue streams
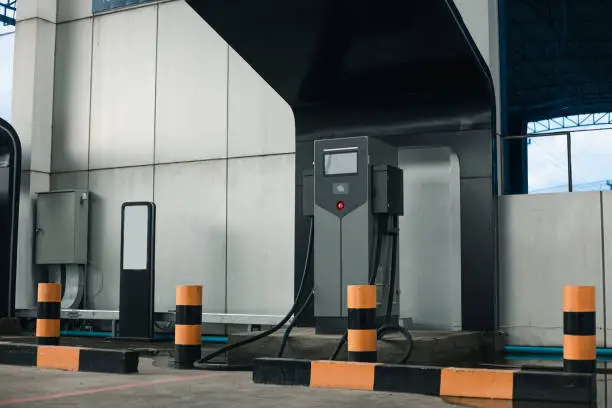
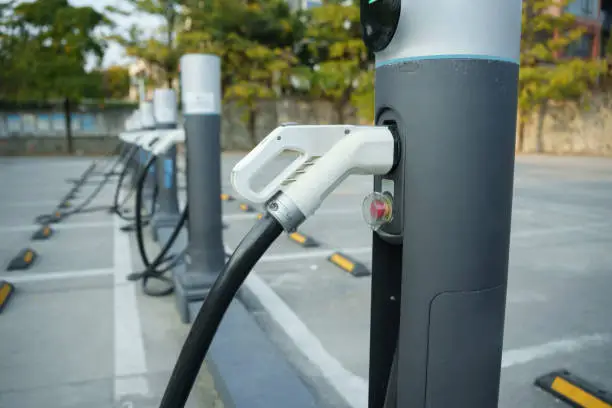
⚡ Solar-Powered EV Charging Hubs: City Planning Guide for 2030
By 2030, there will be over 200 million EVs worldwide. If these are charged only from fossil-fuel grids, emissions are just relocated, not reduced. Solar EV hubs solve this by:
- Generating clean energy on-site
- Reducing peak grid demand
- Providing backup during outages
🔋 What is a Solar EV Hub?
A normal EV station depends only on the centralized grid. A Solar EV Hub includes:
- PV Canopies – shading + solar power generation
- Battery Storage – store daytime excess for night charging
- Smart Inverters – manage the grid connection
- Load Balancing Algorithms – prioritize EV charging
📊 Math Example – Scaling a City Hub
50 EVs per day × 40 kWh each = 2,000 kWh demand

Solar generation = 5 kWh/m²/day × 20% efficiency = 1 kWh/m²/day

Required solar area:
A = 2000 ÷ 1 = 2000 m² ≈ 0.5 acres canopy
🌍 Real-Life Example – Utrecht, Netherlands
- Built EV hub with 250 solar canopies
- Provides 1 MW capacity
- Charges ~300 cars daily
- Also doubles as shaded parking + stormwater management
💰 Cost vs Grid Impact
- 1 MW solar EV hub = ~$1.2–1.5M
- Same EVs on fossil grid = ~$2M over 10 years
- Break-even point: 6–7 years
🏙️ Planning for Cities
- Strategic locations (highways, malls, offices)
- Energy mix: 70–80% solar, rest from grid
- Battery capacity: 2–4 hrs peak load
- Smart scheduling: day (solar) vs night (grid)
🚧 Barriers
- Need land or large rooftop areas
- Higher upfront cost than diesel alternatives
- Policy hurdles (zoning, EV tariffs)
📜 Policy Roadmap
- California: solar EV stations by 2028
- India: highway solar EV pilots (FAME-II)
- Germany: EV hubs resell power to neighborhoods
🔮 Future Prospects (2030)
- Hubs as energy + transport nodes in smart cities
- AI forecasting for weather + EV demand
- Vehicle-to-Grid (V2G) systems: EVs send power back
✅ Final Verdict
Solar EV hubs are mini power plants, not just charging stations. They:
- Cut 80–90% emissions
- Reduce grid stress
- Make EV adoption truly net-zero
⚡Policy Roadmap for 100% Solar Cities: Lessons from First 5 Cities That Tried
Why Solar Cities Matter
Cities consume 75% of the world’s electricity. If we can convert cities to 100% solar power, we cut emissions drastically and save huge costs in the long run. But this requires finance, policy, and technology revolutions.
The 5 Early Movers
- Freiburg, Germany – pioneers of rooftop solar.
- Adelaide, Australia – government-subsidized battery + PV homes.
- San Diego, USA – city-wide commitment to 100% renewable electricity.
- Shenzhen, China – integrating solar + electric transport.
- Dubai, UAE – massive solar parks + rooftop programs.
📑 Policy Category 1: Rooftop Mandates
- Freiburg requires all new buildings to include solar panels.
- Result: 80% rooftop coverage achieved by 2022.
📑 Policy Category 2: Financial Incentives
- Adelaide offered $5,000 battery subsidies.
- Cut payback period from 12 years → 6 years.
- Comparison graph idea:
- X-axis: Years
- Y-axis: ROI
- Incentivized homes break-even twice as fast
📑 Policy Category 3: Grid Flexibility
- San Diego introduced time-of-use pricing.
- Encouraged solar-hour usage → 15% less evening peak load.
📑 Policy Category 4: Transport Electrification
- Shenzhen replaced 16,000 buses with solar EVs.
- Saved nearly 1 million tons of diesel imports annually.
📑 Policy Category 5: Utility Solar Parks
- Dubai’s Mohammed bin Rashid Solar Park (5 GW under construction).
- World record low tariff: $0.015/kWh.
📊 Real-Life Example – Payback Simulation
- Population: 1 million
- Annual demand: 2,000 GWh
- Rooftop potential: 1,200 GWh
- Utility park supply: 900 GWh
- Total solar = 2,100 GWh
⚠️ Principal Barriers
- Intermittency → storage is expensive
- Equity → renters without rooftops are excluded
- Policy → zoning and building codes often lag
Lessons Learned
- Voluntary programs work less than mandatory mandates.
- Incentives for storage + PV ensure success.
- Mix of rooftop + utility farms = best outcome.
- EV integration smooths demand curves.
Roadmap to 2030
- Mandate rooftop solar on all new buildings.
- Promote city-scale storage (batteries + grid storage).
- Build solar-powered motorways with EV integration.
- Enable peer-to-peer solar trading via blockchain.
Important suggestion to go solor
The first 5 solar cities prove that going 100% solar is not just possible, but also profitable. By 2030, the roadmap is clear:
- Mandates – accelerate adoption
- Incentives – make solar economical
- Integration – link solar, storage, and EVs
The world will experience the impact of solar-powered cities for the first time in 2030. The era of carbon-free cities is within reach. 🌎⚡
⚡ Conclusion
Solar power is the solution to the world's biggest energy and environmental problem. Having read as much as can be read on all to do with solar technology domestic applications, transport, large farms and so forth there is no other way solar power is possible but a necessity to a future that is clean.
Among the best benefits of solar power, perhaps, is the urgency of its use in the home. These solar-panel homes save a significant amount of money on electricity bills, are not dependent on anything, and even feed back energy to the grid. In contrast with the conventional electricity, which is fossil-fuel dominant and subject to market volatility, solar power is a renewable and certain one. This research points in the direction that not only is solar power environmentally friendly but also financially sustainable in the long term.
Apart from investment at the individual level, solar power is used for virtually all the amenities of daily living. From showers and illumination to electricity and even agriculture, solar options are abundant. Solar power in such usages is a practical one and renders communities independent to a certain extent from limited sources of power and promotes a culture of embracing clean power.
The environmental impact of solar power can never be overemphasized. By stopping carbon emission, solar panels stop global warming and improve air quality. Solar installations are soundless and pollution-free alternatives to coal- or gas-burning power installations that emit lethal chemicals, and human beings get a chance to inhale fresher air. To nations suffering from rampant pollution, the impact of solar is even greater.
Installing solar panels, as easy as it gets, is still a labor of precision and execution. Expert installation yields the maximum out of the investment by the homeowners. Deterrent measures like substandard panel buying, wrong installation at the wrong pitch, or new agencies can water down the overall efficiency of the system. Spare yourself such idiotism for a longer lifespan and higher returns.
Maintenance is also crucial to the long lifespan of solar panels. Birds, bird droppings, or dust will need cleaning off panels occasionally in order to keep benefiting from full sunlight. Maintenance is not only beneficial to performance but also to the system's lifespan, saving every now and then for replacement. As most solar panels come pre-installed with 20 to 25-year warranties, maintenance can be used to keep extending their lifespan years.
Enormous solar farms are changing the way electricity is produced and transmitted in large amounts. They produce electricity to entire towns and cut down on reliance on traditional power plants. Although they occupy huge expanses of land and create logistical challenges, their advantage in lowering the cost of electricity, creating jobs, and fulfilling country renewable energy goals is more, and therefore they are the focal point of worldwide energy revolution.
Solar energy technology also has a lot to give in the future. Solar paint, transparent solar cells, and hybrid systems are just some of the new solar technologies that are improving the efficiency and affordability of solar. The technologies can be taken even lower in prices and solar integration even for city buildings like windows and cars. Solar power in relation to electric vehicles is also an area with promise. Solar-powered electric vehicle charging stations facilitate a clean and renewable way of transforming transportation by diminishing dependence on fossil fuels in the generation and transmission of electricity.
Naturally, deployment of solar mass is going to be challenging. Upfront cost, weather dependence, hostile governmental policy, and opposition from oil fossil companies are all behemoths in the way. But with mounting awareness and technology improvement, these are being met by subsidies, creative finance contracts, and global treaties to deploy more renewables.
All in all, the whole body of knowledge in every solar energy sector confirms its transformative potential. To households, it promises affordability and autonomy. To society, it promises clean uses of daily life and biome enhancements. To commerce, it promises solid and strong bulk power in the form of solar farms. To the future, it promises innovation, EV readiness, and solutions to world energy demands. Of course, they can be overcome by smart planning, education, and policy. Solar power isn't new it's the energy tomorrow. Through the adoption of it to the fullest degree, human beings can possibly achieve an economically viable, environmentally conscious future.